
Editor's note: Poindexters, set your brains to "analyze." Andrew Hiscock comes back with another ridiculously researched piece that is quite interesting if you take the time to follow it through. Which you should! -Greg
If you've checked out some of my more statistics-focused articles (NeoGAF charts and Critically Acclaimed Retail Bombs), you know that I enjoy playing around with numbers. My last such article had me knee deep in gamerankings.com numbers. This work made me ask a series of questions that were irrelevant to my purposes at the time, so this time out, I decided to see if I could find those answers. First, I wanted to know how the games for each console are doing four years into the current generation. Secondly, I wanted to know how these games are doing over time. With this in mind, I ran out and got the gamerankings scores for every single current generation console game (with 5 reviews or more), and played around with the numbers a bit. The results are below.
Aggregate Aggregator
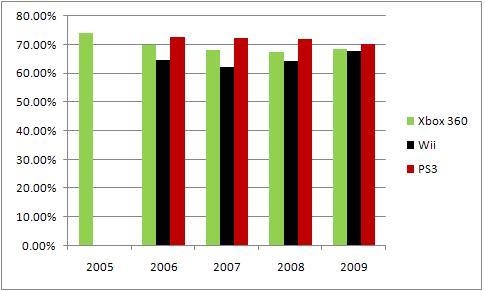
Fig. 1: Average review aggregate scores by console, year by year
The first figure represents the average review aggregates for all games (5 reviews or more) in a given year for each console. This includes everything for each console that has received 5 or more reviews -- retail releases, downloads, retro games, everything. The raw numbers are given below.
Xbox 360
2005 - 74.12%
2006 - 69.90%
2007 - 68.24%
2008 - 67.53%
2009 - 68.45%
Wii
2006 - 64.80%
2007 - 62.09%
2008 - 64.44%
2009 - 67.91%
PS3
2006 - 72.61%
2007 - 72.31%
2008 - 71.83%
2009 - 70.42%
To ensure there was no funny business going on, I took the standard deviations for each console, year by year, and they pretty much all came out similar (12 to 13 percentage points), with the exception of Xbox 360's 2005 games, which tended to clump together a little bit more (with a SD of 8).
We can see that the scores are fairly high. I would say that this is due to two aspects: games journalists tend to score high, weighting each point in a X-point scale differently, and the fact that many outlets don't bother to cover games they would, presumably, give a low score (either because they are uninterested or they perceive their audience to be uninterested).
There is not as much as a difference as I expected. Given my previous number crunching, I expected better scores for the PS3, poorer scores for the Wii, but the numbers were closer than I would have surmised.
Interestingly enough, you can see two distinct trends: Xbox 360 and PS3 are trending downward while the Wii is trending upward. I can't make conclusions, but I will offer a couple suggestions to explain these trends. As for the downward trends I will suggest:
- Game journalists have higher expectations of games as a console ages.
- Game developers are less willing to experiment with new design as a console gets old, relying more on established formulas, to which critics respond to in a less postive manner.
And as for the upward trend, I will suggest:
- With the Wii's new control scheme, it has taken developers some time to develop games that fully realize the control scheme in ways that critics appreciate.
- Games don't sell very well on the Wii so developers are making greater efforts to produce quality products in an effort to boost sales.
- Games journalists are getting used to the control scheme and are less likely to have negative views of it.
The Good, The Bad, and The Ratios
To investigate further, I decided to see what percentage of all games were considered "good" (a review aggregate >80%) and what percentage of all games were considered "bad" (a review aggregate <40%).
Fig. 2: Percentage of all games considered to be good by console, year by year
We can see two of the trends mentioned above preserved when we look at this data. First, the Xbox 360 has a lower percentage of good games as time goes on, bottoming out in 2009 where 17.20% of games released are considered to be "good". Also we can see that the Wii is trending upward.
With the exception of 2009, the percentage of "good" games on the PS3 was trending upward, the reverse of what was expected given the earlier data. In order for the trend to appear in the previous section, we would expect a lower percentage of "bad" games, which we will see in the next chart.
Fig. 3 Percentage of all games considered to be bad by console, year by year
As you can see, there was a dip in "bad" games on the PS3, accounting for a higher percentage in "good" games. I can make a couple suggestions as to why this is, although it would be foolhardy to make any definite conclusions:
- Due to a lower install base, developers of lower budget games (which normally, although not always, tend to produce lower scored games) opted not to release titles on the PS3.
- Sony may have a higher approval standard in terms of licensing games for release.
- It simply was a good year for PS3 releases (hey, I'm not always looking for the second gunman).
The Wii, as expected, saw a good portion of "bad" games, especially early on, and the downward trend confirms the data we have seen earlier.
Microsoft is a little all over the place, but I can suggest that the trend toward higher percentages of "bad" games suggests that lower quality titles are being produced on the cheap to take advantage of the large install base. Alternatively, this is evidence that review standards get higher the further along in a console's life cycle. You'll also notice no data for 2005. This was due to the fact that no games for the Xbox 360 had a score lower than 40%.
Finally, I wanted to take a look at ratios of "good" games to "bad" games, to get an idea of relative health of each console's release schedule.
Fig. 4: Ratios of good games to bad games by console, year by year
Here we can see the downward trends for the Xbox 360 and PS3 again, although the PS3 has experienced much higher ratios (as high as 32 "good" games to each "bad" game in a 2007). The Wii did terrible after release with 3 "good" games for every 2 "bad" games in 2006 and bottoming out in 2007 about 7 "good" games for every 10 "bad" games. This has improved significantly over time.
Future Research
This has provided an interesting insight into how games are reviewed and what kind of games each console is releasing. There was a peculiar trend, in that all data tended to clump together in 2009. Since we have only gone through the first half of 2009, with the largest buying season (and a remarkable amount of releases to go with it) still ahead of us, it would be interesting to see how games are reviewed month by month. Data is currently being compiled, and you can expect an article in the near future addressing the issue.
However, I will not reserve the number fun for myself. Do you have questions you would like to answer? Do you have fun playing with Excel workbooks?
Drop me a line at andrewjhiscock@gmail.com and I can send you a nice and clean Excel file with all the data I used for the numbers. At the least, it'll save you half a day of cutting and pasting from gamerankings.com (not to mention removing all sorts of irrelevant data).